X - Link Ready is an easy-to-use measurement data acquisition system
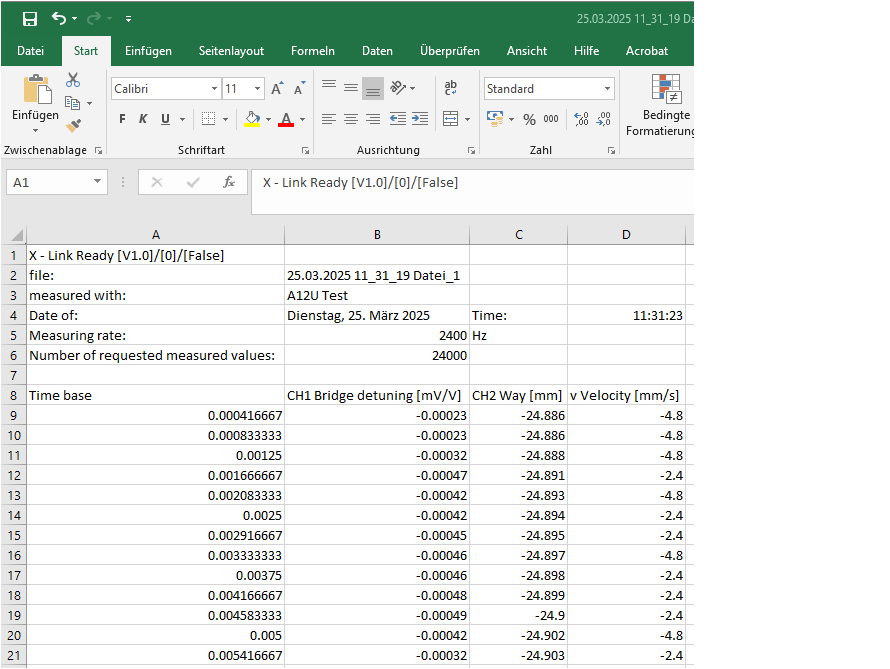
This basic version supports our measuring amplifiers with the RS232C, USB and WLAN interfaces. Optionally, other devices with USB CDC interface can also be integrated with the «Option Plus».The versatile design enables data to be transferred at the touch of a button, e.g. to EXCEL, where the cursor is positioned in order to transfer measured values to your template.
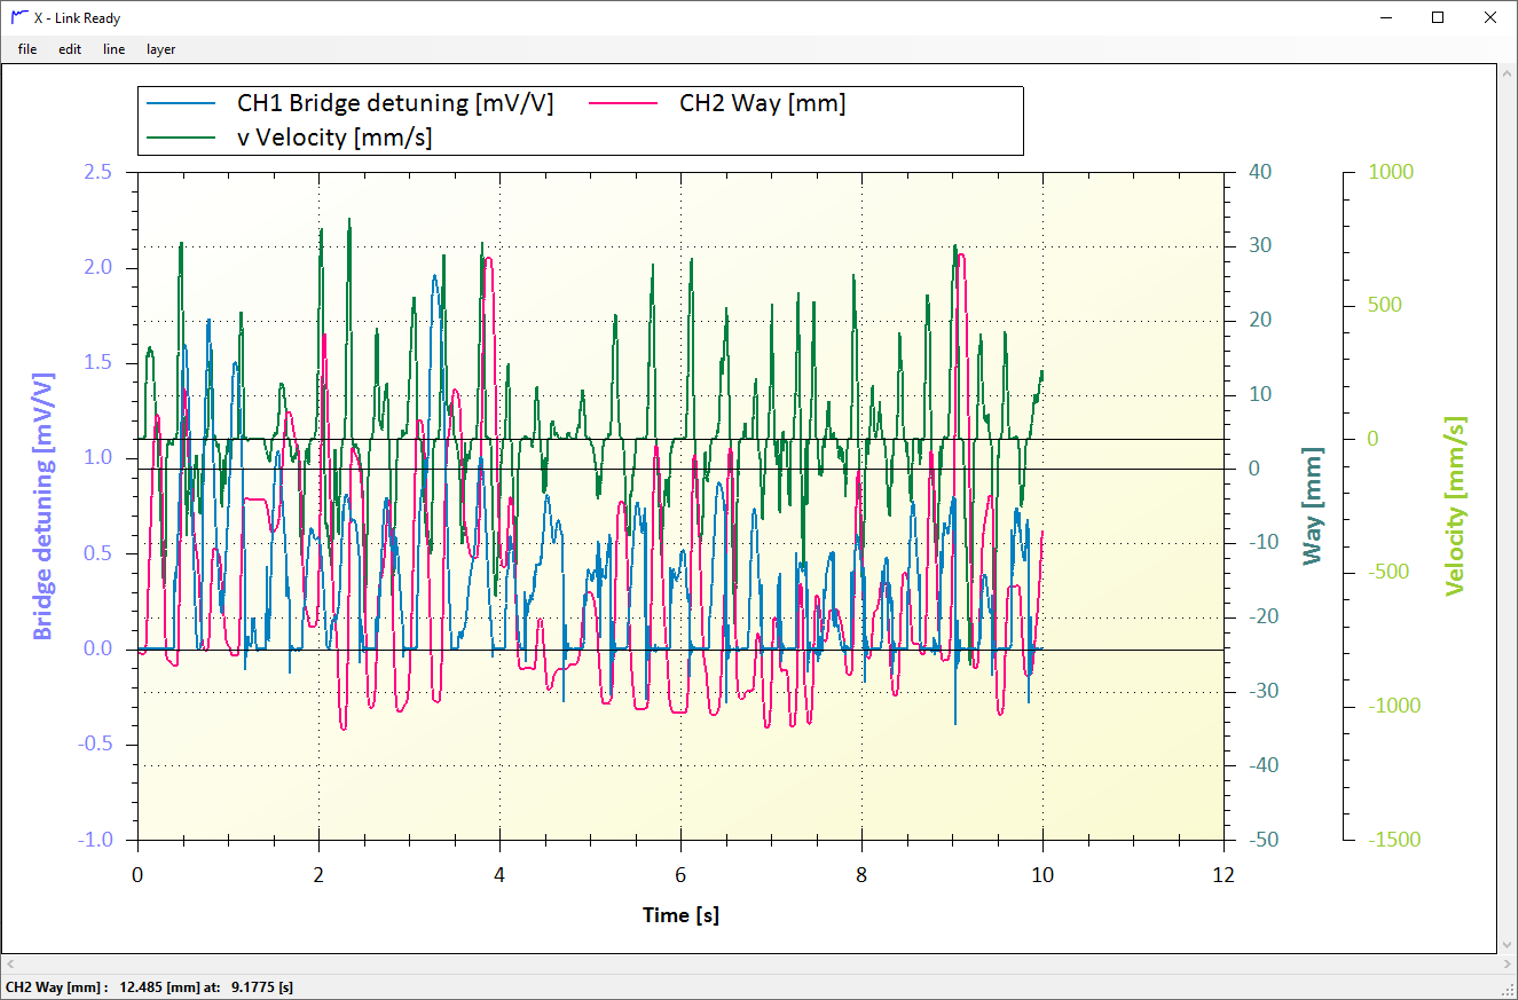
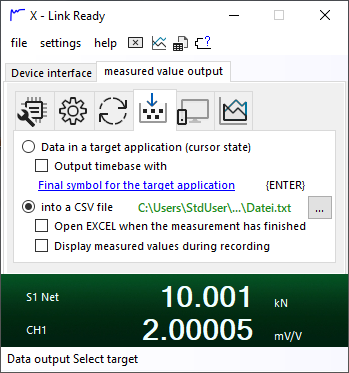
However, it is also possible to carry out long-term measurements with a low measurement rate and the time base date / time with limit value monitoring, or to record dynamic measurements by saving the data in a CSV file and drawing a graph at the same time.
The programme allows a defined number of measurements to be repeated x times, or a creep measurement (10 measurements every 30 seconds) to be carried out.
Specific changes can be made to the measuring amplifier in the programme so that the setup programme does not have to be opened all the time.
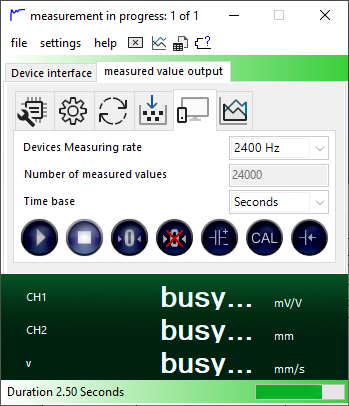
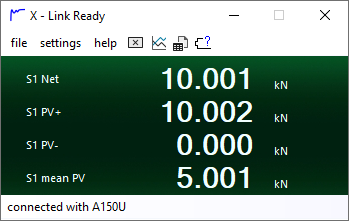
The measured value window displays the measured values enabled in the measuring amplifier and can be minimised to save space on the screen.
Options:
Plus for all devices with RS232C interface with ASCII protocol is available


| with the device interfaces | RS232C |  |
 |
| Language | |
|
 |
|
 |
 |
 |